Hiplot plugin (self-contained Apps generated by Shiny or other techniques are not included) uses JSON to communicate with the front end, it is not easy to code and maintain both R script and JSON files at the same time. In current stage, a formal Hiplot plugin has the following structure in a directory:
plot.R: where the core computation implemented.ui.json: UI controls for the plugin.data.json: set the default arguments to UI widgets and the backendplot.R.meta.json: set plugin metadata like author, emails, etc.README.md: detail usage of the plugin in English.README.zh_cn.md: detail usage of the plugin Chinese.
To happier make Hiplot plugin, we develop HiSub and let it help us convert a R script with special comments to a Hiplot plugin (excepts the two README.* files).
Firstly clone the tool to local machine.
git clone https://github.com/hiplot/hiplot-plugin-generator
cd hiplot-plugin-generator
Then you can prepare a R script named source.R with:
./hisub.R templateNext modify the source.R as your wish and convert it into your Hiplot plugin.
./hisub.R source.R <output-directory>For better use this tools, I recommend you to generate a soft link to the hisub.R with command similar to
ln -s ~/Documents/GitHub/hiplot-plugin-generator/hisub.R ~/.local/bin/hisubChange the first path to your cloned hisub.R path and change the second path to a path storing the executable file.
NOTE, the second path should be in system PATH variable so you can call HiSub with hisub.
For preparing the core R script, let's get started with the Hello World plugin for Hiplot, which shows the core concept of Hisub and most common setting.
The contents of helloworld.R:
# @hiplot start
# @appname helloworld
# @apptitle
# Hiplot Hello World
# Hiplot 示例插件
# @target basic
# @tag test dotplot
# @author your name
# @url your project link
# @citation any reference you should link to
# @version 0.1.0
# @release 2021-01-01
# @description
# en: One sentence to describe this plugin.
# zh: 插件一段话简单介绍。
# @main helloworld
# @library ggplot2 readr
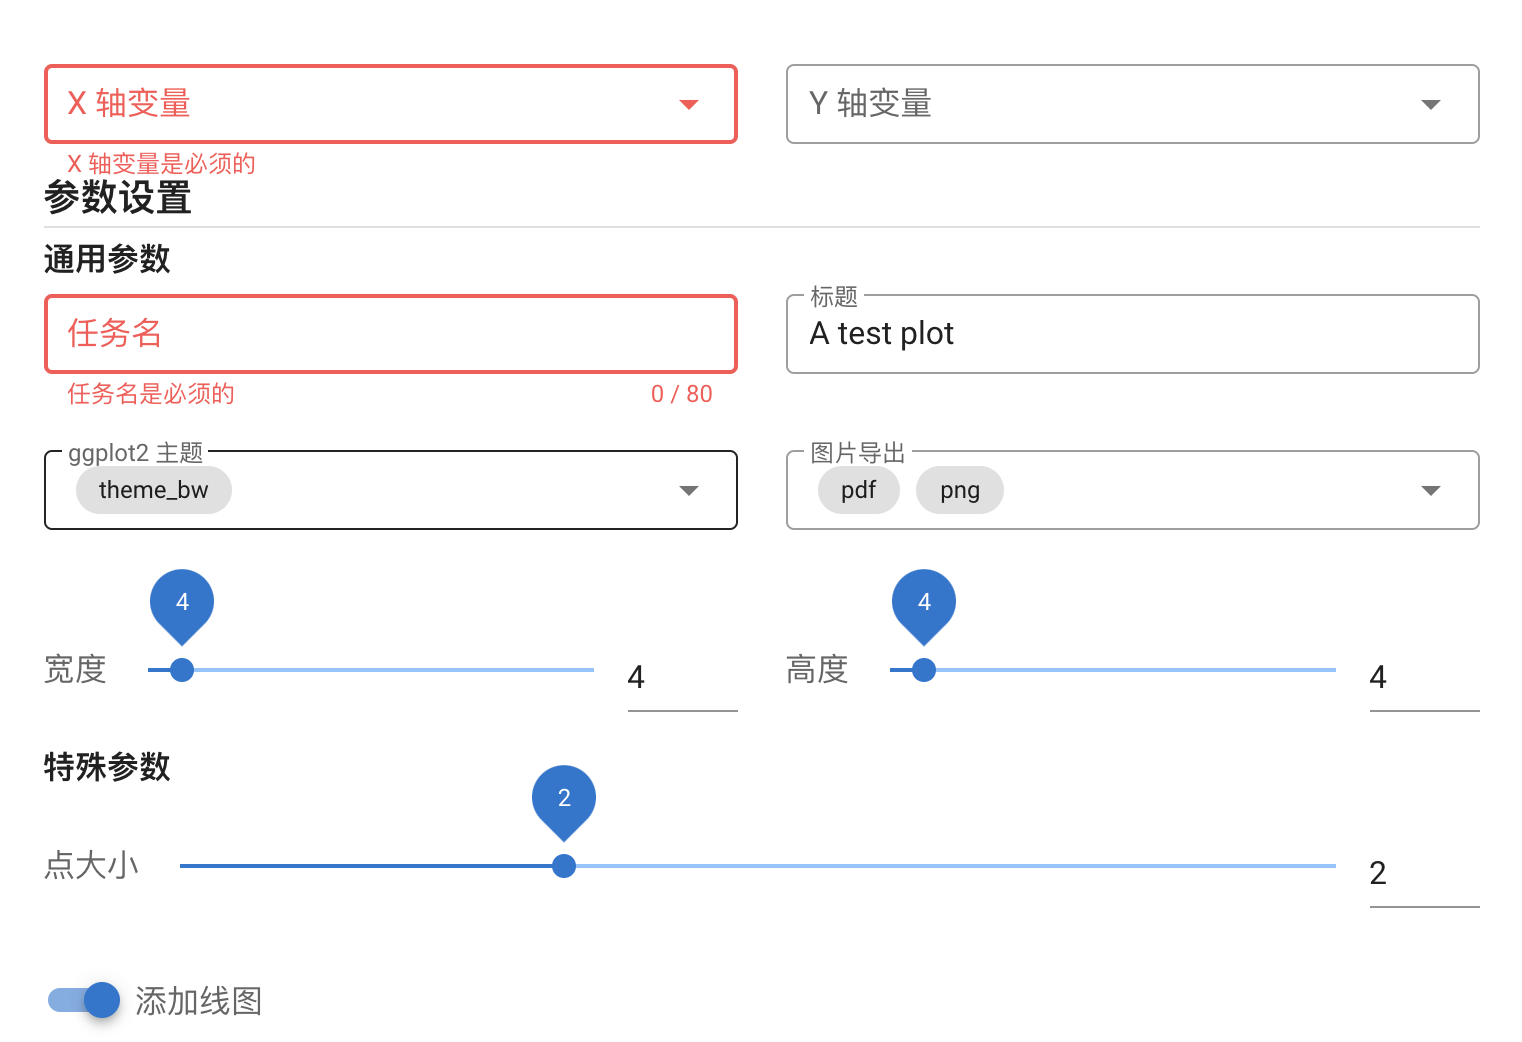
# @param data export::data::hiplot-textarea::{"default": "data.txt", "required": true}
# en: Data Table
# zh: 数据表
# @param x export::dataArg::data::{"index":1, "default": "mpg", "required": true}
# en: X Axis Variable
# zh: X 轴变量
# @param y export::dataArg::data::{"index":2, "default": "vs", "blackItems": "carb", "required": false}
# en: X Axis Variable
# zh: Y 轴变量
# @param size export::extra::slider::{"default":2, "min":0.5, "max":5, "step":0.5, "class":"col-12"}
# en: Dot Size
# zh: 点大小
# @param add_line export::extra::switch::{"default": true, "class":"col-12"}
# en: Add Line
# zh: 添加线图
# @return ggplot::["pdf", "png"]::{"cliMode": true, "title": "A test plot", "width":4, "height": 4, "theme": "theme_bw"}
# @data
# # You can write the code to generate the example data
# # 'data.txt' described in parameter data, or you can
# # omit this tag and submit prepared data files.
# # File size <100Kb is recommended.
# # 此处可以编写生成示例数据(建议小于 100Kb)的代码
# # 示例数据文件需要跟数据表格参数对应起来
# # 或者忽略该标签,提交已经准备好的示例数据
# library(readr)
# data("mtcars")
# write_tsv(mtcars, "data.txt")
# @hiplot end
library(ggplot2)
helloworld <- function(data, x, y, size = 2, add_line = TRUE) {
if (y == "") stop("y must be provided!")
p <- ggplot(data, aes_string(x = x, y = y))
p <- p + geom_point(size = size)
if (add_line) {
p <- p + geom_line()
}
# Here export a ggplot object
# Or the whole main function generate a basic R plot
return(p)
}We can divide the contents into 2 parts:
- The comment PART describe the metadata of this plugin and how the parameters map to a web widget (e.g.,
select) and their default values. - The code PART describe how to generate the result plot and we should include the core plotting code in a function.
NOTE: we use tag
@xxxto recognize the useful information. HiSub will only parse the comments between@hiplot startand@hiplot end. And only the parameters withexport::will be parsed.
With the R script, we can generate the Hiplot plugin with command:
./hisub.R examples/helloworld.R test_helloHiSub accept as many as parameters you can put, but only the first will be treated as the R script to parse
Others:
- The last argument should be a directory path for the plugin, typically it has the same name as your plugin name.
- Other middle arguments will be treated as necessary files (like
README.md, currently it cannot be scripts called by the 1st R script ) and copied to the destination directory (specified by the last argument).
Then you can submit the generated data.json and ui.json to https://hiplot.com.cn/developer/plugin-preview (You can also read exmaples provided by this link and see how to set the parameter settings) to see how it works. For our "Hello World", it looks like:
This section I will briefly describe supported tags, for more information, please read the Docs.
@hiplot, 1 line, seperates the useful comments parsed by HiSub, onlystartandendare valid.@appname, 1 line, set your plugin name (cannot have space, it will be used to set the plugin URL on hiplot).@apptitle, 3 lines, set your plugin title.- The 2nd line set English title.
- The 3rd line set Chinese title.
@target: 1 line, where the target url should be deployed to, includesbasic,advance,clinical-tools, etc.@tag: 1 line, tags for your plugin, seperated by space.@author: 1 line, your name.@url: 1 line, your project link, like GitHub for your plugin (Optional).@citation: many lines, your reference or how to cite you (Optional).@version: 1 line, the version of this plugin.@release: 1 line, the release date of this version.@description: many lines, briefly describe the plugin.- For English, you should start the line with
en:. - For Chinese, you should start the line with
zh:.
- For English, you should start the line with
@main: 1 line, the main function to call for plotting.@library: 1 line, required packages for your plugin, so Hiplot team can check if they are installed.@param: many lines. From the 2nd line, it is same as@description. For the 1st line, it has the rules:<param_name> export::<param-type>::<widget-type>::<param_setting>- All
param_names are used to describe the parameters in the main function, here ishello world(). param-typecan be data (for data table), dataArg (for selecting column names in a data table), extra (custom parameters in your main function).widget-typecan be slider, switch, select, autocomplete, color-picker, text-field.param_setting(JSON format) depends on thewidget-type. In most common cases, adefaultitem is supported to set default value for the parameter, others items will be passed to front end for setting widget UI and behavior.
@return: 1line, it has the rules:<output-type>::<output-format>::<output-setting>output-typecan beggplot,plot(for plots not generated by ggplot) anddirectory(outputing a whole directory, you need read docs for more).output-format(JSON format) sets the figure output format like PDF, PNG, etc.output-setting(JSON format) corresponds to default general parameters in a plot which provided in Hiplot UI but cannot be mapped to parameters of the main functions, liketitle,palette,theme,widthandheightof the plot, etc. (cliModeis suggested enable, it works faster for simple plugin).
@data: many line, it contains code to generate example data described in data table parameters (Optional).
See doc.md
© 2020 Hiplot team